Fact Finding Techniques Journal 6-Read Chapter 7, Fact Finding Techniques and Data, Chapter 6.1.5 Strategies to Improve Listening in Groups, 6.1.6 the listening Summary and watch the two videos under this module about statistical analysis of data. Answer the questions below.
Continue in the Journal you started last week for Chapters 5-8.
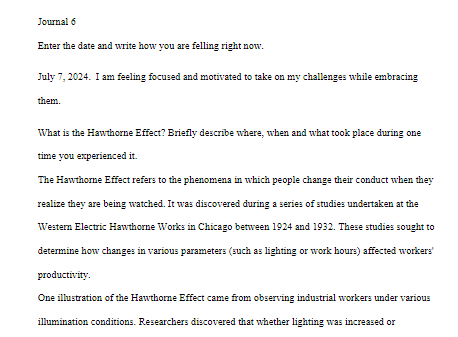
Enter the date and write how you are felling right now.
- What is the Hawthorne Effect? Briefly describe where, when and what took place during one time you experienced it.
- Identify the two fundamental points that must be followed for effective listening to occur.
- Of anyone in the world, who is the best listener you know? What does the person do (or not do) that makes him/her so effective? Give an example of how the person has listened well.
- Think about some of the ways people demonstrate good listening among people you know. Develop a questionnaire, really make one in MS Word. Have at only two open ended, closed ended questions and maybe some range-of-response questions on the questionnaire. Your questionnaire should contain at least 6 questions. The questions need to determine how someone knows people are listening to them. You may also want to ask what impact technology and specifically the cell phone has on listening in their opinion. Use one of the sampling techniques described in Chapter 7.3 to identify a target sample size of people you interact with, like members of your family, friends, and peers. Administer your questionnaire to these people. Keep your sample size to 5-10 people. The questionnaire may be administered face to face in an interview or virtually. You should submit a copy of the questionnaire MS Word Journal 6 file so I can review it. It can be a screen-shot or picture if you use on online survey. Records, summarize and analyze your results in Excel. Submit the Excel file Journal 6. Do not print to a PDF as instructed in the second video. Include:
a. A copy of the questionnaire (or picture of all questions if you use something like Google Forms)
b. Write a brief description of the sampling technique you used
c. Show the raw data results of the whole questionnaire in Excel
d. Perform statistical analysis on some of the data which can be as simple as summing and averaging results
e. Create a chart representing one interesting result from the data
f. Briefly explain why or why not your results support what you have learned about active listening in Chapter 6
g. After analyzing your results, reflect on what you did. Identify one thing you would change to gather better data next time.
h. Then compare your results with those of your teammates during your next team meeting.
Answer Preview- Fact Finding Techniques Journal 6-INT 2840

