
Spring A 2026 MATH.40.HSF2 Statistics: Week 13: Homework Assignment 7
Week 13: Homework Assignment 7
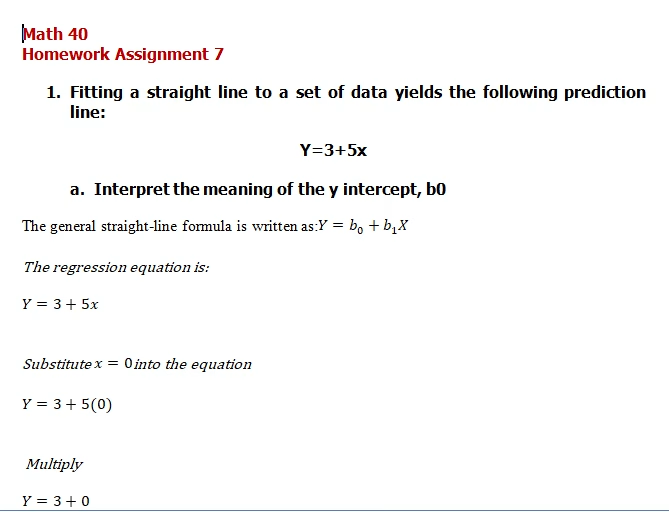
- Fitting a straight line to a set of data yields the following prediction line:
Y=3+5x
- Interpret the meaning of the y intercept, b0
- Interpret the meaning of the slope, b1
- Predict the value of y for x=4
- If the values of x in problem range from 3 to 24, should you use this model to predict the mean value of y when:
- x = 3?
- x = -3?
- x = 23?
- x = 25?
Note: Each sub-item above is answerable by yes or no.
- Fitting a straight line to a set of data yields the following prediction line:
Y = 15 – .09x
- Interpret the meaning of y intercept, b0
- Interpret the meaning of slope, b1
- Predict the value for y when x = 5
- How do you interpret a coefficient of determination, r2 = 0.85?
- If SSR = 45 and SSE = 5 determine SST and compute the coefficient r2 and interpret its meaning.
- If SSR = 66 and SST = 88 compute the coefficient r2 and interpret its meaning.
- If SSE = 10 and SSR = 50 determine SST and compute the coefficient r2 and interpret its meaning
- If SSR = 120, why is it impossible for SST to = 110?
Tutorial for Homework Assignment 7
$10.00