Week 14: Final Exam Preparation
Instructions
-
Submit your Microsoft Word file in the submission folder in Week 14. You may also submit your Excel file.
-
Use the exact format provided.
-
No late submissions or extensions will be accepted.
-
You may consult materials, but you may not consult any other person.
-
Projects will not be returned.
-
This project is worth 20% of your final grade.
Name:
THE SCENARIO
You are the Director of Admissions for a large business school. Students seeking admission must take the GMAT (Graduate Management Admission Test). You want to gather inferential statistics about students’ GPAs. You also wish to determine whether a student’s GMAT score is useful for predicting GPA at graduation.
THE DATA
The GMAT scores and GPAs at graduation of 20 randomly selected students are provided in the file GMAT Data.xlsx.
-
X-variable: GMAT score
-
Y-variable: GPA
INSTRUCTIONS FOR ANALYSIS
-
Answer all questions below.
-
Perform all calculations using Excel or PHStat.
-
Attach output where required.
-
If calculating manually, show formulas and all steps.
-
Unsupported answers will receive zero credit.
-
Round all calculations to at least four decimal places.
QUESTIONS
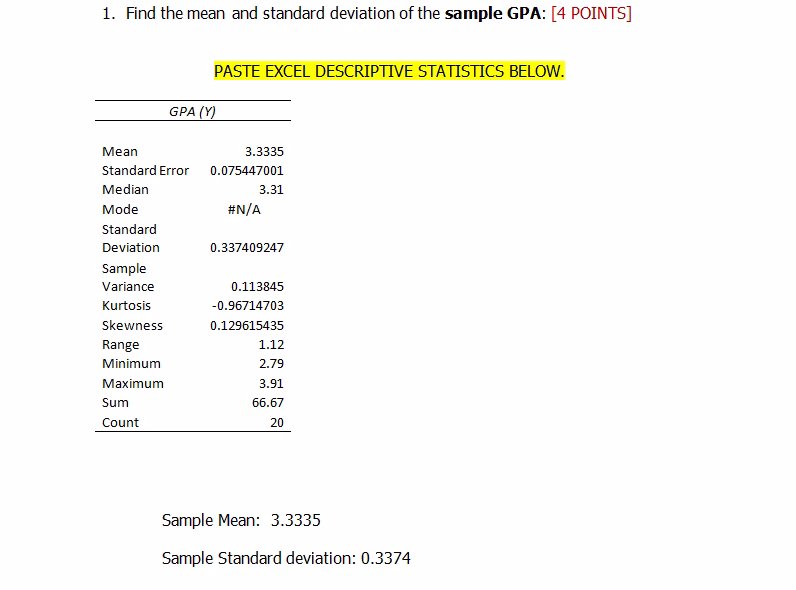
1. Descriptive Statistics [4 POINTS]
Find the mean and standard deviation of the sample GPA.
-
Paste Excel descriptive statistics output.
-
State the sample mean.
-
State the sample standard deviation.
2. Confidence Interval for Mean (Unknown σ) [6 POINTS]
Assume the population is normally distributed and the population standard deviation is unknown.
-
Construct a 95% confidence interval for the true mean GPA.
-
Paste PHStat output.
-
State the margin of error.
3. Sample Size Determination (Known σ) [4 POINTS]
Assume:
-
Population standard deviation = 0.30
-
Confidence level = 95%
-
Margin of error ≤ 0.10
-
Determine the required sample size.
-
Paste PHStat output.
4. Hypothesis Test for Regression Slope [14 POINTS]
Test whether GMAT score is a significant predictor of GPA.
-
State null and alternative hypotheses.
-
State significance level.
-
Report test statistic and p-value.
-
State decision rule.
-
State decision.
-
Provide conclusion.
5. Hypothesis Test for Mean GPA [6 POINTS]
Test whether the mean GPA is greater than 3.2.
-
Paste PHStat output.
-
State conclusion.
6. Repeat Hypothesis Test (New Alpha) [4 POINTS]
Repeat Question 5 with α = 0.05.
-
Paste PHStat output.
-
Describe what changed.
7. True/False Statements [6 POINTS]
Mark each statement as TRUE (T) or FALSE (F):
-
The p-value is the probability that the null hypothesis will be rejected.
-
The second test has a smaller reject region than the first.
-
The test statistic measures the distance between the mean being tested and the sample mean.
-
The null hypothesis will be rejected provided alpha exceeds the p-value.
-
The critical value is the boundary between the reject and do-not-reject regions.
-
The p-value is the probability of obtaining a test statistic equal to or more extreme than the sample result if the null hypothesis is true.
8. Confidence Interval for Proportion [8 POINTS]
Given: 8 out of 20 students are women
-
Construct a 95% confidence interval for the population proportion.
-
Paste PHStat output.
-
Interpret the interval.
9. Precision of Interval [2 POINTS]
-
Comment on the precision of the confidence interval.
-
Provide a reason.
10. Sample Size for Proportion [4 POINTS]
Assume:
-
Population proportion = 0.45
-
Margin of error ≤ 0.05
-
Confidence level = 95%
-
Determine required sample size.
-
Paste PHStat output.
LINEAR REGRESSION SECTION
11. Scatter Plot [4 POINTS]
-
Create and paste a scatter plot of GMAT vs GPA.
12. Regression Output [4 POINTS]
-
Perform regression using PHStat.
-
Paste full regression output.
13. Regression Equation & Metrics [10 POINTS]
From the regression output:
-
Write the regression equation.
-
Identify the slope.
-
Identify the y-intercept.
-
State the standard error of estimate.
-
State the coefficient of determination (R²).
14. Hypothesis Test for Linear Relationship [8 POINTS]
Test at α = 0.05:
-
State null and alternative hypotheses.
-
Report p-value.
-
State decision.
-
State conclusion.
15. Interpretation [6 POINTS]
-
Interpret the y-intercept.
-
Interpret the slope.
-
Predict GPA for GMAT = 600.
16. Residual Analysis [12 POINTS]
-
Paste residual plot.
-
Comment on:
-
Linearity assumption
-
Equal variance assumption
-
17. Normality of Residuals [8 POINTS]
-
Paste normal probability plot.
-
State whether normality assumption is satisfied.
-
Provide justification.
18. Confidence & Prediction Intervals [4 POINTS]
For X = 600:
-
Construct 95% confidence interval for mean response.
-
Construct 95% prediction interval.
-
Paste PHStat output.
19. Model Evaluation [4 POINTS]
-
Discuss how good the regression model is.
-
Provide supporting reasons.
20. Additional Predictors [4 POINTS]
-
Suggest at least two other independent variables that could help predict GPA.
Tutorial for Final Exam Preparation