
Spring A 2026 MATH.40.HSF2 Statistics: Week 15: Math 40 Final Exam
Week 15: Math 40 Final Exam
Instructions:
- Submit your Microsoft Word file in the Week 14 folder.
- You may also attach your Excel file.
- Use the exact format provided.
- No late submissions or extensions will be granted.
- You may consult materials, but not other people.
- Projects will not be returned.
- This project is worth 20% of your final grade.
Name:
THE SCENARIO:
You are the Director of Admissions for a large business school. Students must take the GMAT to apply. You want to analyze GPA statistics and determine whether GMAT scores can predict GPA at graduation.
THE DATA:
GMAT scores (X) and GPA at graduation (Y) for 20 randomly selected students are provided.
QUESTIONS
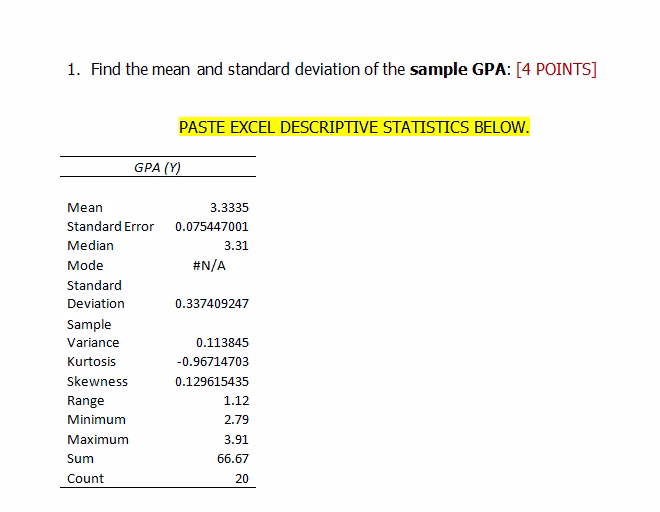
1. Descriptive Statistics [4 POINTS]
- Find the mean and standard deviation of the sample GPA.
- Paste Excel descriptive statistics output.
2. Confidence Interval (Unknown σ) [6 POINTS]
- Construct a 95% confidence interval for the true mean GPA.
- Paste PHStat output.
- State the margin of error.
3. Sample Size Determination (Known σ) [4 POINTS]
- Determine required sample size for a 95% confidence interval with margin of error ≤ 0.10.
- Assume σ = 0.30.
- Paste PHStat output.
4. Hypothesis Test (Regression Slope) [14 POINTS]
-
Test at α = 0.01:
H₀: β₁ = 0
H₁: β₁ ≠ 0 - Include:
- Test statistic
- p-value
- Decision rule
- Decision
- Conclusion
5. Hypothesis Test for Mean GPA
- Test whether mean GPA > 3.2.
- Paste PHStat output.
6. Repeat Hypothesis Test
- Change α to 0.05.
- Describe what changes (if any) occur.
- Paste PHStat output.
7. True or False Section
Mark each statement as True (T) or False (F):
- The p-value is the probability that the null hypothesis will be rejected.
- The second test has a smaller rejection region than the first.
- The test statistic measures the distance between the hypothesized mean and the sample mean.
- The null hypothesis is rejected if alpha exceeds the p-value.
- The critical value separates the rejection and non-rejection regions.
- The p-value is the probability of obtaining a test statistic as extreme or more extreme assuming H₀ is true.
8. Confidence Interval for Proportion [8 POINTS]
- Given 8 out of 20 students are women:
- Construct a 95% confidence interval.
- Paste PHStat output.
- Comment on the precision of the interval.
9. Sample Size for Proportion [4 POINTS]
- Assume p = 0.45
- Determine required sample size for margin of error ≤ 0.05
- Paste PHStat output
LINEAR REGRESSION SECTION
10. Scatter Plot [4 POINTS]
- Create and paste scatter plot (GMAT vs GPA).
11. Regression Analysis [4 POINTS]
- Perform regression using PHStat
- Paste full regression output
12. Regression Output Interpretation [10 POINTS]
State:
- Regression equation
- Slope
- Y-intercept
- Standard error of estimate
- Coefficient of determination (R²)
13. Hypothesis Test for Regression [8 POINTS]
- Test if a linear relationship exists at α = 0.05
Include:
- Null hypothesis
- Alternative hypothesis
- p-value
- Decision
- Conclusion
14. Interpretation [6 POINTS]
- Interpret the y-intercept
- Interpret the slope
- Predict GPA when GMAT = 600
15. Residual Analysis [12 POINTS]
- Paste residual plot
Determine whether assumptions are satisfied:
- Linearity
- Equal variance
Provide justification.
16. Normality Check [8 POINTS]
- Paste normal probability plot of residuals
- State whether normality assumption is satisfied
- Explain reasoning
17. Confidence & Prediction Intervals [4 POINTS]
- Determine 95% confidence and prediction intervals for X = 600
- Paste PHStat output
18. Model Evaluation [4 POINTS]
- Evaluate how good the regression model is for predicting GPA
- Provide justification
19. Additional Variables
- Suggest at least TWO other independent variables that could improve the model
Tutorial for Math 40 Final Exam
$35.00